 TUTORIAL TUTORIAL
-
- Preparing a data file
-
Since Ngraph makes a graph by loading data files, you need to first prepare a data file by using an editor, calculation program, control-software for experimental equipments, and so on.
- Determining a type of the graph
-
Next, you can determine the type of the graph through [Graph]-[New] menue.
Frame graph, section graph, and cross graph are available.
- Open a data file
-
Please open the data file through [File]-[Open] menue.
Using a control button shown below is also possible.
Then, a file dialogbox will open in which you can specify the data-column, plot-type, and so on.
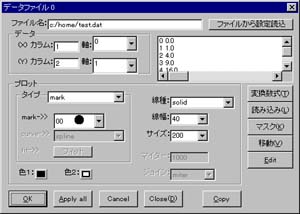
Here, please simply close it by OK button.
- Drawing
-
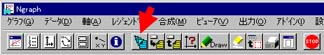
In order to draw a graph, you have to select the menue of [Viewer]-[Draw].
Or simply using the following control button is also possible.
- Changing plot-type
-
Now you have a graph whose data points are plotted by marks of a closed circle.
Let's try to change the graph in that drawn by a curve.
In order to do this, please make a double click on the data file displaied in "Data Window" as shown below.
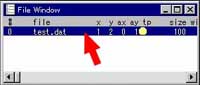
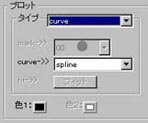
Then, a file dialogbox will open.
You can change the plot-type into "curve" as shown below.
In this dialogbox, you can also change the width, style, and color of the curve as you like.
After drawing graph in the method written in 4 again, you have a graph plotted by a curve.
- Plotting with both mark and curve
-
Furthermore, let's try to make the graph in which data points are plotted by both mark and curve.
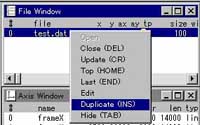
In order to do this, please select "Duplicate" in a pop-up menue which appears by pushing a right button of your mouse on "Data Window" as shown below.
Then, the same data file is opened twice in "Data Window".
Using "Insert" key is also possible.
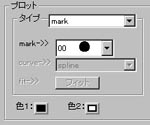
Then, please make a double click on the dupicated data-file as shown below
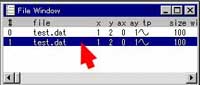
and change the plot-type in "mark" in the file dialogbox.
- Legend
-
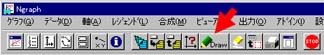
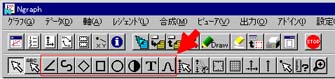
Control buttons as shown below are available in order to make a legend-text, arrow, and so on in your graph.
After choosing the control button corresponding the type of the legend you would like to put it on, please determine the position of the legend by your mouse on "Viewer Window".
- Drag and double click on "Viewer Window"
-
You can move graphic objects and change its settings by a drag and double-click, respectively, on "Viewer Window".
Zooming is also possible.
Note that there are four kinds of pointer-mode in Ngraph. These work for legend plus axis, legend only, axis only, and plotted data only.
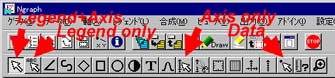
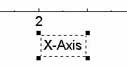
After choosing a control button corresponding to the graphics object you would like to change its settings, and making a click on the object,
a sorrounding frame of a dotted line appears indicating that the object has a focus of the mouse.
Then, a drag and double-click becomes available.
- Evaluation of plotted data
-
It should be noted that some operations, such as an evaluation of the protted points, are only assigned to a control button (these operations are not assigned to a menue).
|
 Brief Guide